Santa Monica is the most deliberately polished of LA’s beach towns — an independent city of 8.3 square miles tucked between the Pacific Ocean and the 405, with its own government, its own school district, and an unusually strong concentration of walkable urban pockets by LA standards. In 2026, its eight distinct neighborhoods trade at dramatically different price points depending on proximity to the ocean, to Montana Avenue, and to the core walkable commercial districts. This guide covers how to navigate those neighborhoods and the market they make up.
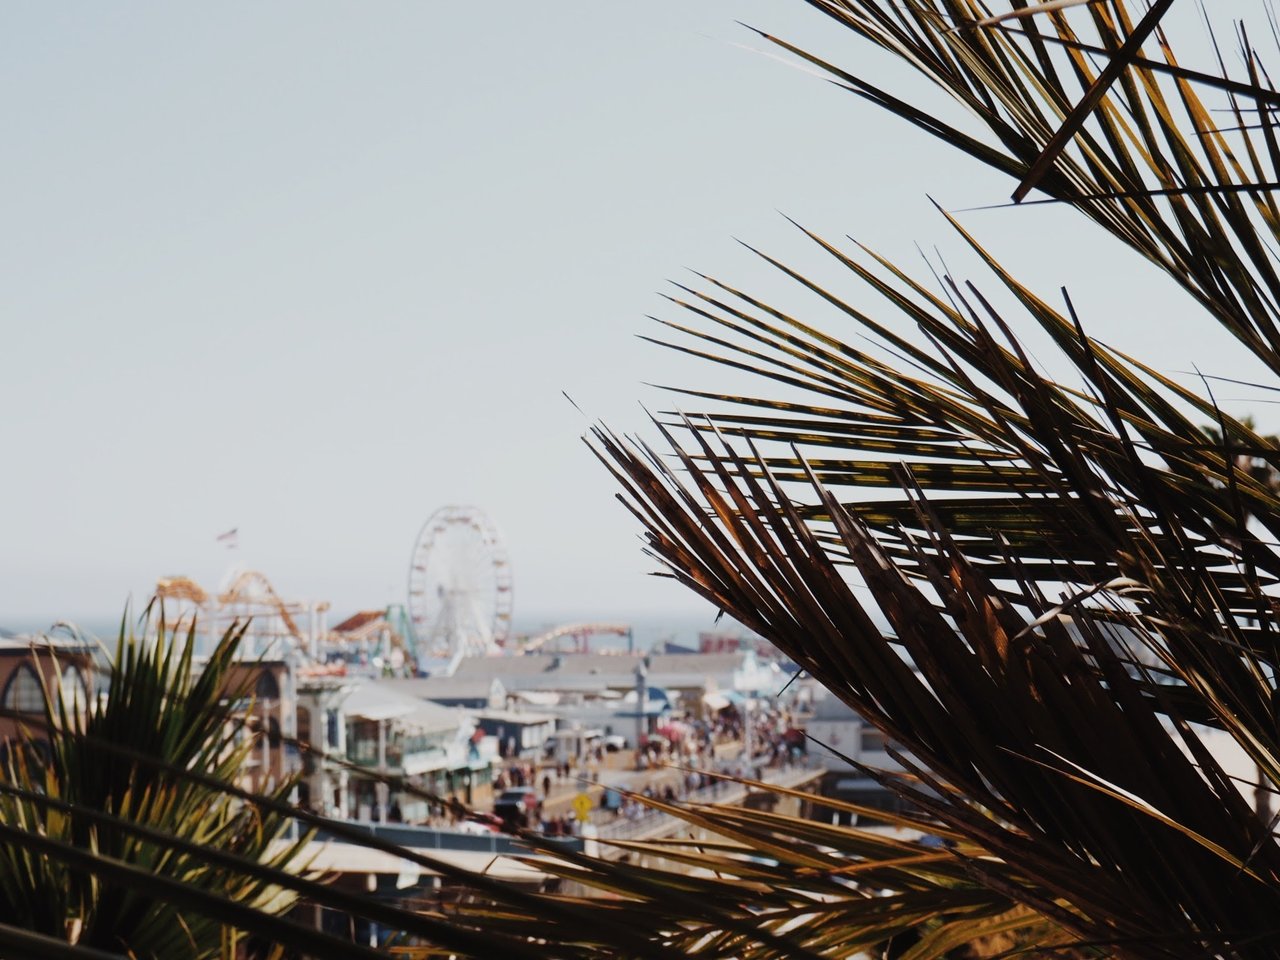
Santa Monica was founded as a resort town in 1875 and has spent 150 years balancing tourism and residential life. The Santa Monica Pier opened in 1909 and remains the city’s most recognized landmark, anchored today by Pacific Park’s solar-powered Ferris wheel. The Third Street Promenade, originally opened as the Santa Monica Mall in 1965, was reimagined as a three-block car-free promenade in 1989 after a $10 million renovation — it remains a defining pedestrian-first retail district for the city. For broader context, see the Santa Monica Wikipedia entry.
Santa Monica is small enough to feel cohesive but divided enough to have genuinely different character block to block. The main residential neighborhoods buyers typically evaluate:
Santa Monica’s housing stock spans the full range of LA beach-town architecture. Traditional and Cape Cod homes dominate the premium North of Montana blocks. Spanish Revival and Mediterranean homes cluster through the older residential grid. Mid-century homes fill in the 1950s-70s layer. Contemporary architectural homes and condos — many with true ocean views — are the newest generation. Bungalows, often restored and updated, are one of the city’s signature entry-level products.
Santa Monica is one of the more measured Westside markets right now. Single-family homes citywide carry a median sale price around $3.85M per early 2026 data, though that number includes the very high North of Montana averages and looks different at the pocket level. Condos citywide sit around $1.25M. Single-family homes average 31 days on market; condos 46. The 90402 zip (North of Montana) has been selling at roughly 98.4% of asking, indicating strong pricing power at the top of the market.
One of Santa Monica’s defining advantages: the Santa Monica-Malibu Unified School District (SMMUSD), regarded as one of the stronger public school districts in greater LA. This is a material reason many families choose Santa Monica over neighboring Venice or other Westside addresses — Venice, by contrast, is served by LAUSD. School access is one of the clearest drivers of the premium North of Montana commands.
Santa Monica pricing is pocket-dependent to an unusual degree. A home on the 800 block of a North of Montana street and a comparable home in Mid-City can carry Santa Monica addresses and trade at very different price-per-foot. For buyers: understanding which pocket your target lives in — and what that pocket’s actual comps look like — is the difference between overpaying and buying well. For sellers: marketing to the right buyer (families for North of Montana, creative professionals for Ocean Park, investors for Downtown condos) is how listings clear faster and at better prices.
If you’re moving to Santa Monica from elsewhere, our stress-free moving guide covers the practical logistics.
Buyers considering Santa Monica usually weigh:
Santa Monica is the answer if you want a polished beach city with its own school district, walkable retail, and pocket-level variety. Venice fits if you prefer creative edge. Brentwood fits if you prefer privacy and inland family life.
Whether you’re buying your first beach-adjacent home, selling a long-held Santa Monica property, or trying to figure out which of the eight neighborhoods fits your life, I’d love to help. Browse the current Santa Monica listings above, or reach out directly for a conversation about your goals and the current market.
91,535 people live in Santa Monica, where the median age is 42.9 and the average individual income is $90,657. Data provided by the U.S. Census Bureau.
Total Population
Median Age
Population Density
Average individual Income
There's plenty to do around Santa Monica, including shopping, dining, nightlife, parks, and more. Data provided by Walk Score and Yelp.
Explore popular things to do in the area, including Organic & Slow Bakery, Demetri Fitness, and Santa Monica Hitting Partner.
| Name | Category | Distance | Reviews |
Ratings by
Yelp
|
|---|---|---|---|---|
| Dining · $$ | 3.61 miles | 5 reviews | 5/5 stars | |
| Active | 2.44 miles | 7 reviews | 5/5 stars | |
| Active | 1.67 miles | 7 reviews | 5/5 stars | |
| Active | 1.98 miles | 16 reviews | 5/5 stars | |
| Active | 3.04 miles | 6 reviews | 5/5 stars | |
| Active | 3.09 miles | 9 reviews | 5/5 stars | |
| Beauty | 1.66 miles | 7 reviews | 5/5 stars | |
| Beauty | 1.4 miles | 8 reviews | 5/5 stars | |
| Beauty | 1.05 miles | 7 reviews | 5/5 stars | |
| Beauty | 3.43 miles | 7 reviews | 5/5 stars | |
|
|
||||
|
|
||||
|
|
||||
|
|
||||
|
|
||||
|
|
Santa Monica has 46,457 households, with an average household size of 1.92. Data provided by the U.S. Census Bureau. Here’s what the people living in Santa Monica do for work — and how long it takes them to get there. Data provided by the U.S. Census Bureau. 91,535 people call Santa Monica home. The population density is 10,883.9 and the largest age group is Data provided by the U.S. Census Bureau.
Total Population
Population Density Population Density This is the number of people per square mile in a neighborhood.
Median Age
Men vs Women
Population by Age Group
0-9 Years
10-17 Years
18-24 Years
25-64 Years
65-74 Years
75+ Years
Education Level
Total Households
Average Household Size
Average individual Income
Households with Children
With Children:
Without Children:
Blue vs White Collar Workers
Blue Collar:
White Collar: